A look into opportunities and challenges for US decarbonization
in cooperation with CESI - by Bruno Cova & Luca Migliorini
The amount of CO2 emissions due to human activities has grown over the years, as can be seen in Figure 1, with an increasing impact from Asia in the last decade compared to Europe and the US, which lowered their emissions levels.
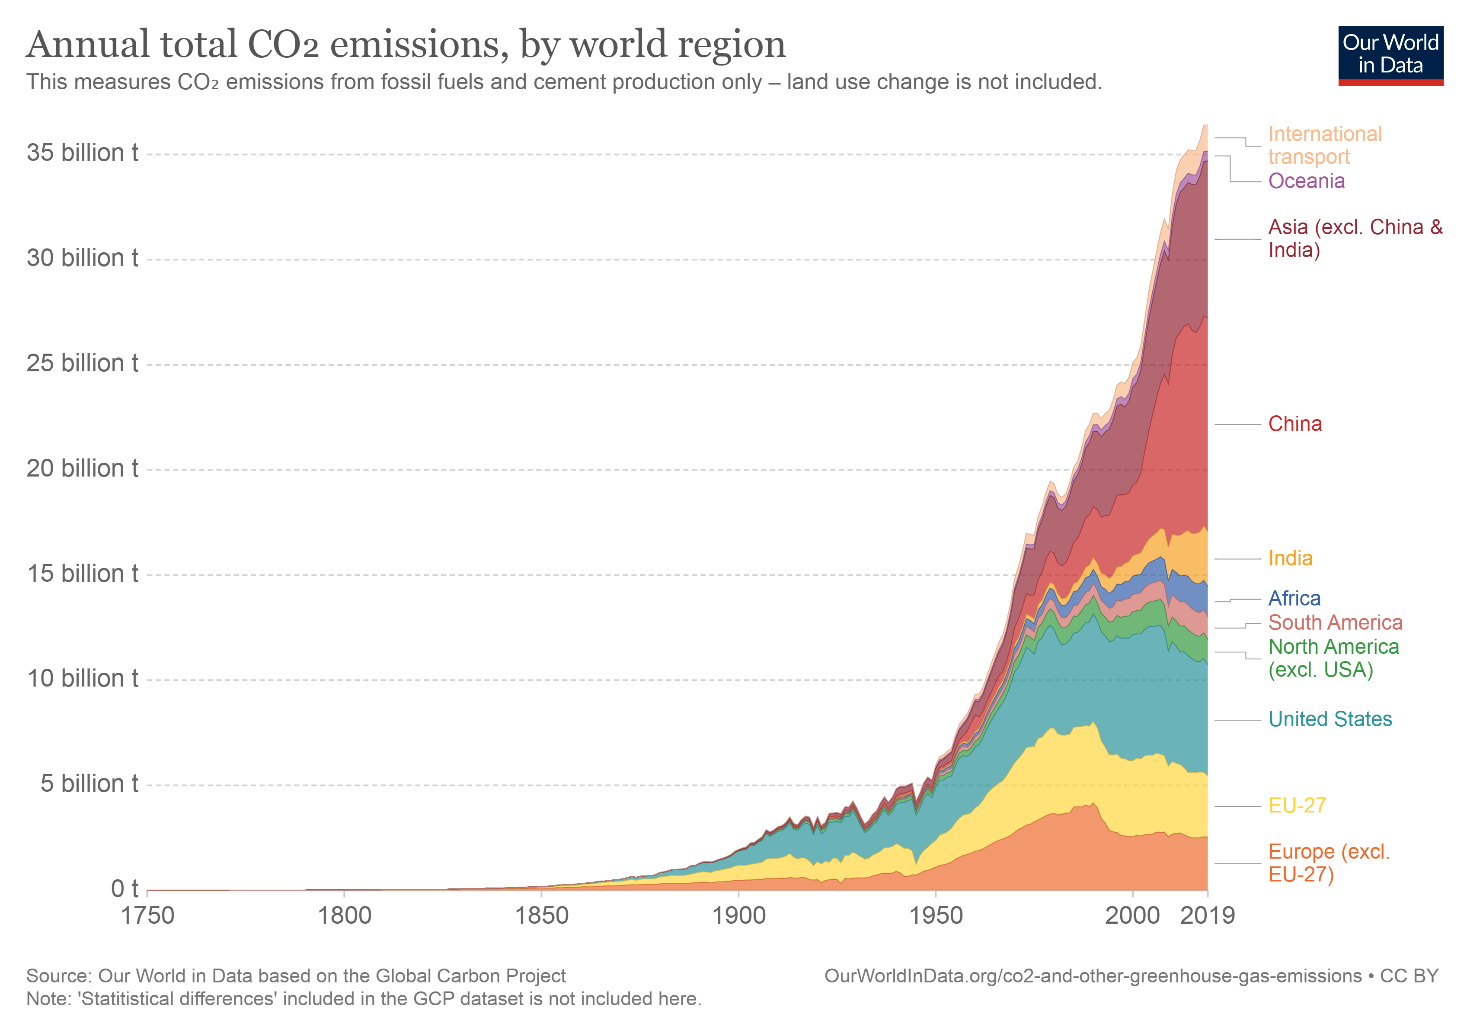
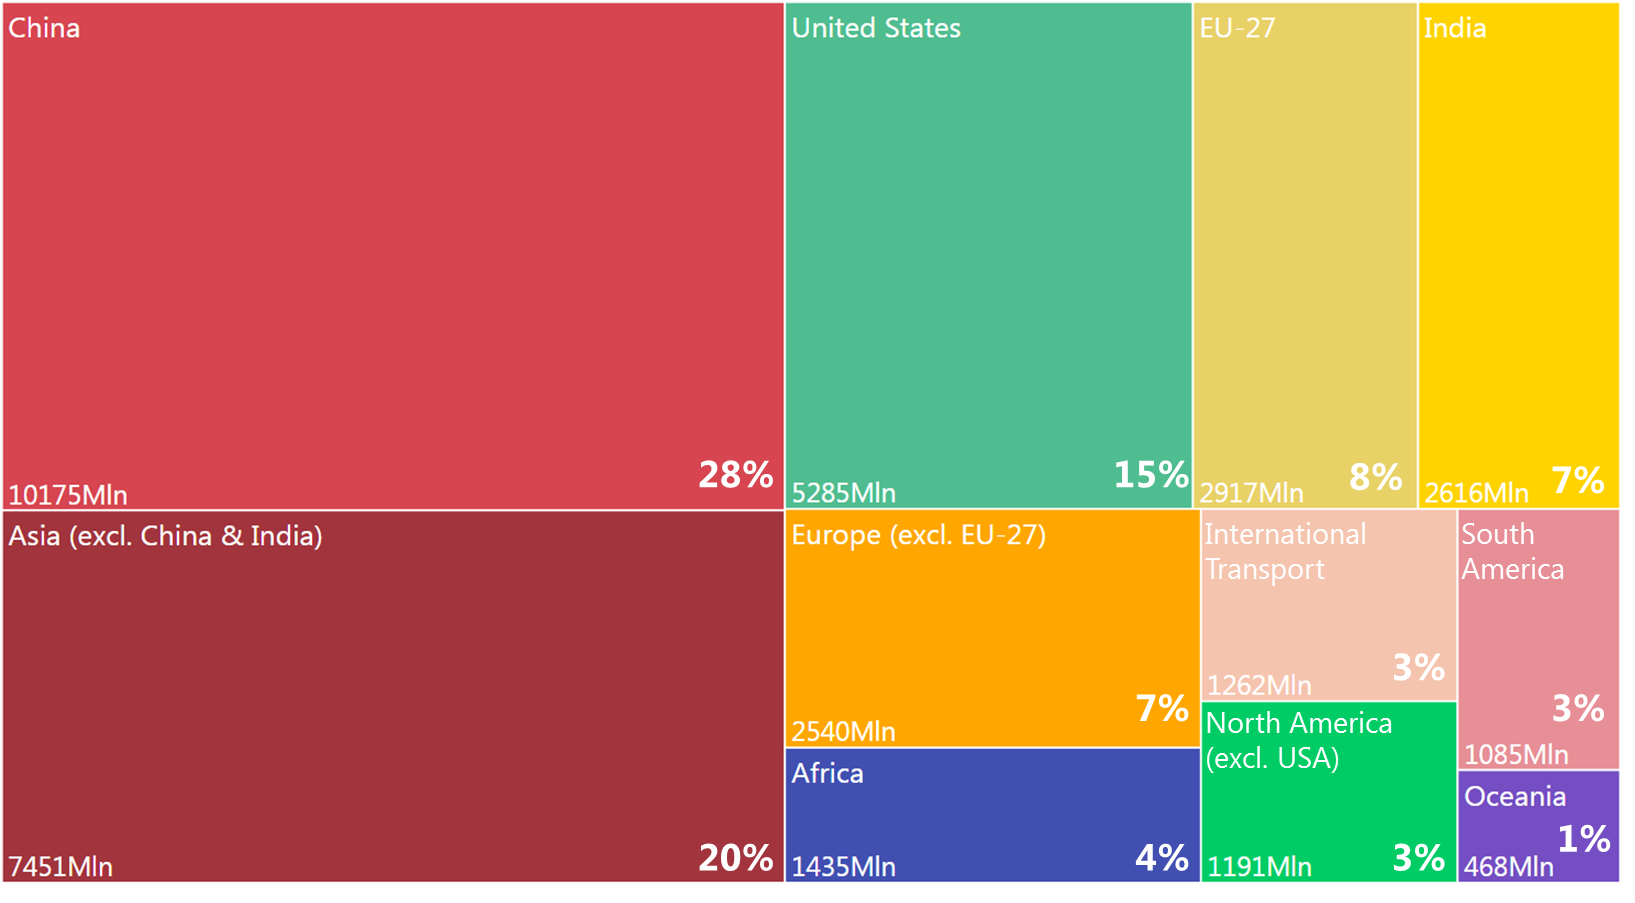
China was indeed the greatest contributor to total CO2 emissions in 2019 with 28% of the world share, while the entire Asian continent is responsible for more than half of global emissions. The US is second in the emissions ranking with 15%, whereas the EU is responsible only for 8% of the total.
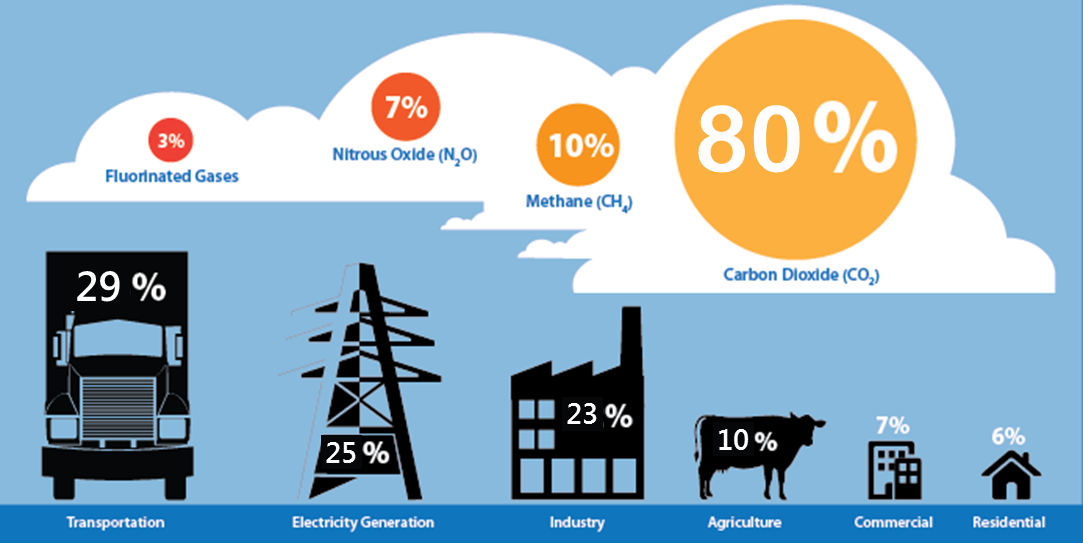
The power sector has been historically one of the main contributors to greenhouse gas (GHG) emissions, notably CO2, with power generation largely based on fossil fuels and particularly on coal. However, the rise of renewables in recent years has decreased the emissions associated to electricity generation: In the US, over the past few years, transportation has been the main sector responsible of GHG emissions, as displayed in Figure 3.
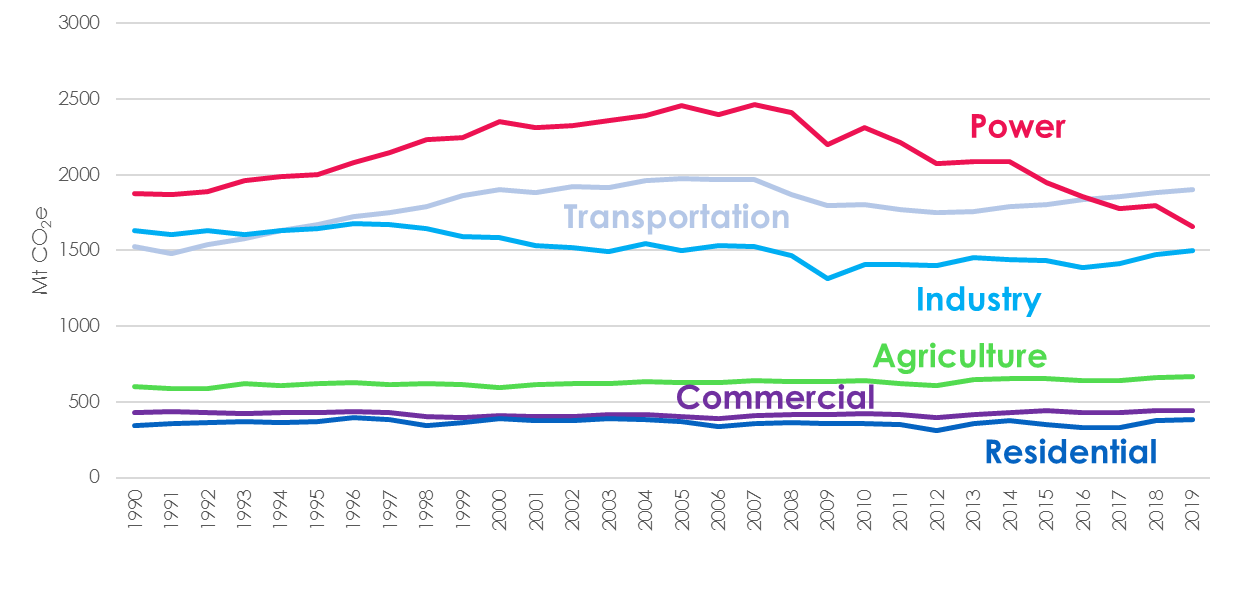
In 2019, GHG emissions in the US for the power sector accounted for one fourth of the total and, according to the target indicated by President Joe Biden, this share must reach zero by 2035.
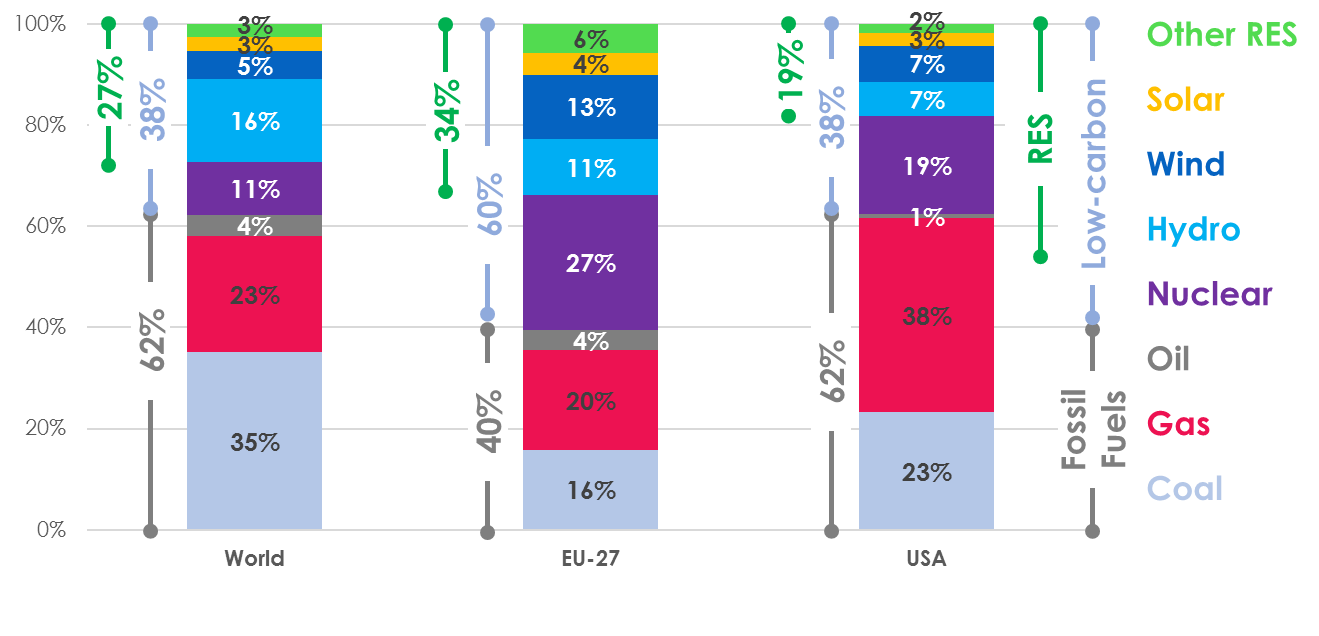
Focusing on the power sector, the share of electric generation based on fossil fuel worldwide was 62% in 2019, whereas the EU outperformed in comparison to the world average, with 60% of generation based on low-carbon technologies. The US mirrors the same breakdown as the global level between fossil fuels and low-carbon generation, but it still lags behind in the renewable share, where efforts are needed to ensure compliance with Biden’s objectives.
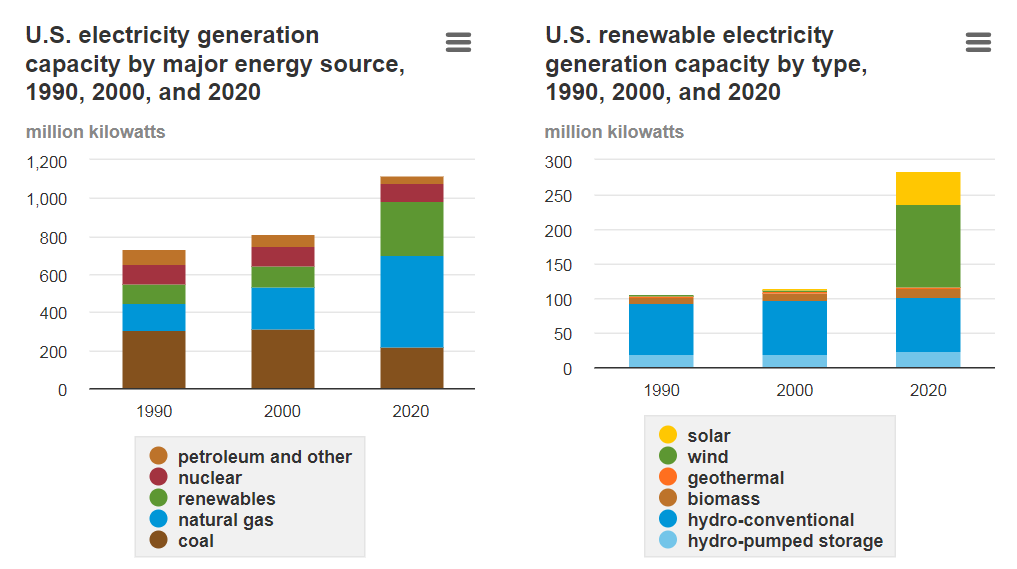
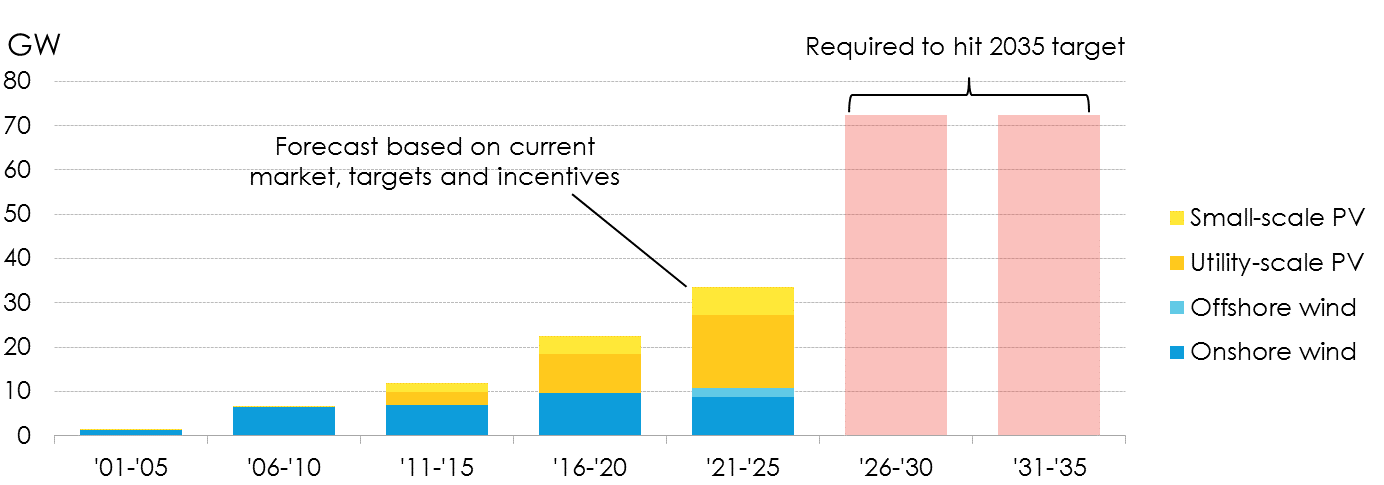
On the other hand, the trend in US power capacity installation bodes well for an increased decarbonization, as showed in Figure 6, where in the last twenty years an increase in renewables power plants occurred, mainly driven by wind and solar. At the same time, there has been a phase-out of coal power plants, substituted with natural gas capacity.
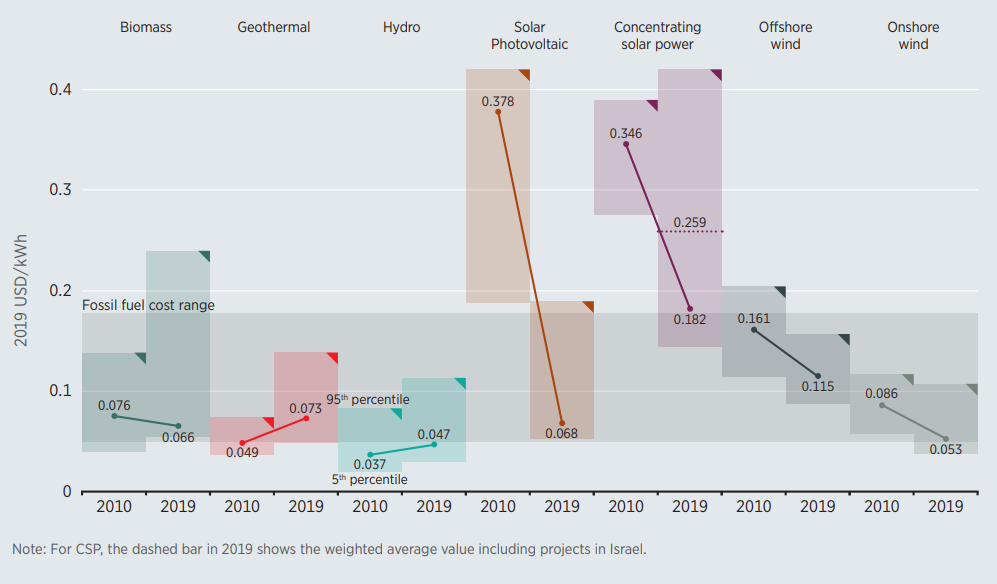
Investments in photovoltaic (PV) are fostered by a decline in Capital Expenditures – Capex – making it competitive with conventional technologies. The same holds true for wind power plants that, though having higher capital costs, are characterized by greater capacity factors, making the levelized cost of electricity (LCOE) competitive with fossil fuels plants and utility scale PV.
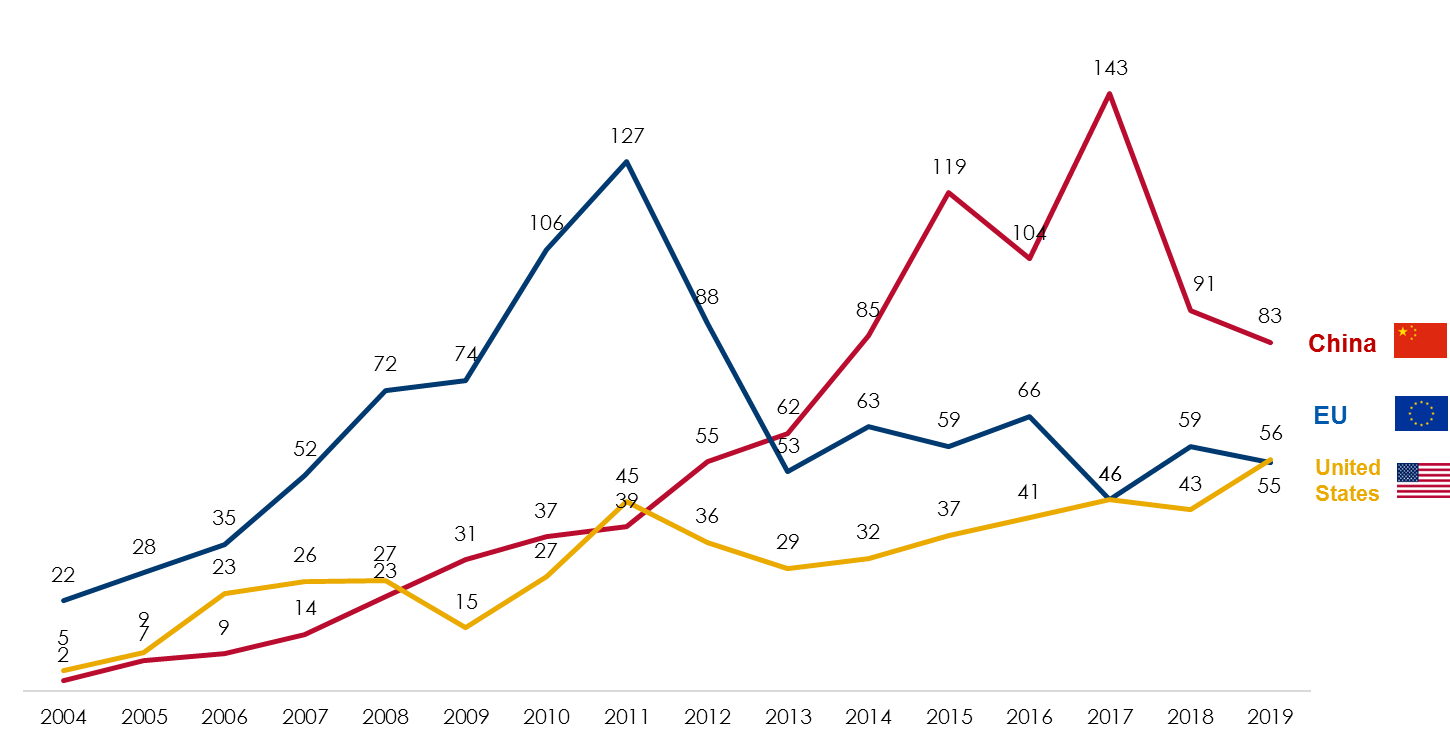
Over the years, the US has increased investments in renewable energy. In 2019, it surpassed the EU with $56 billion, second to China which now leads in clean energy spending.
However, there is still much to be done in the US: According to a Bloomberg New Energy Finance analysis, the annual additions of US wind and solar power plants from 2026 to 2035 need to triple the average of the last five years to satisfy the target of carbon-free electricity by 2035.
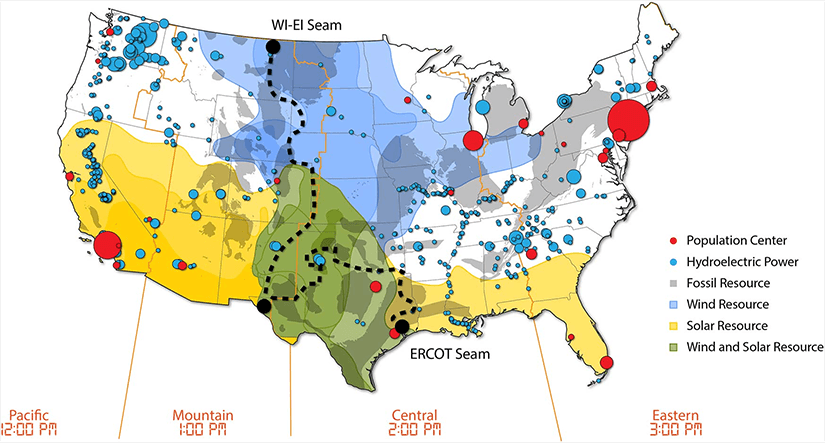
Wind and solar energy have great potential in the US, however these resources are unevenly distributed across the country calling for a combined investment effort in new Variable Renewable Energy Sources (V-RES) power plants and transmission corridors to the load centers. Figure 10 shows that the Southern States have plenty of solar resources, with the greatest potential near the border with Mexico. Wind contribution is greater in the central area of the country. The presence of large urban centers in the Northeast and the industrial network in the Midwest require a substantial amount of energy, currently provided by fossil resources. The three major components of the country’s power system – the Western Interconnection, the Eastern Interconnection, and the Electric Reliability Council of Texas – work almost autonomously. Small quantities of electricity are transmitted between the areas due to limited transfer capacity. The realization of new interconnections would enable a more integrated power system that could efficiently transfer clean energy from the areas with greater presence of renewables to the load centers.
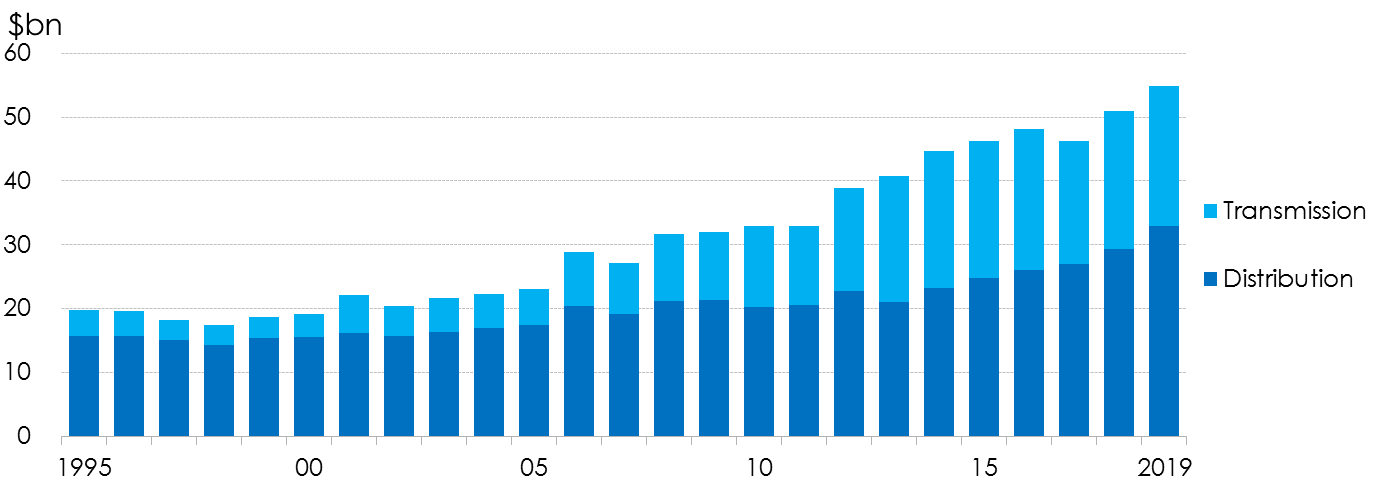
The indications given within the American Jobs Plan, with the deployment of 20 GW of high-voltage power lines, together with the historic trend of network investments, suggest that the US is taking this direction. Specifically, the investments in transmission and distribution infrastructure have almost doubled in the last 15 years, as displayed in Figure 11. The concurrent change in the energy mix implies that this increase is mainly attributable to the reinforcements needed for supporting V-RES integration.
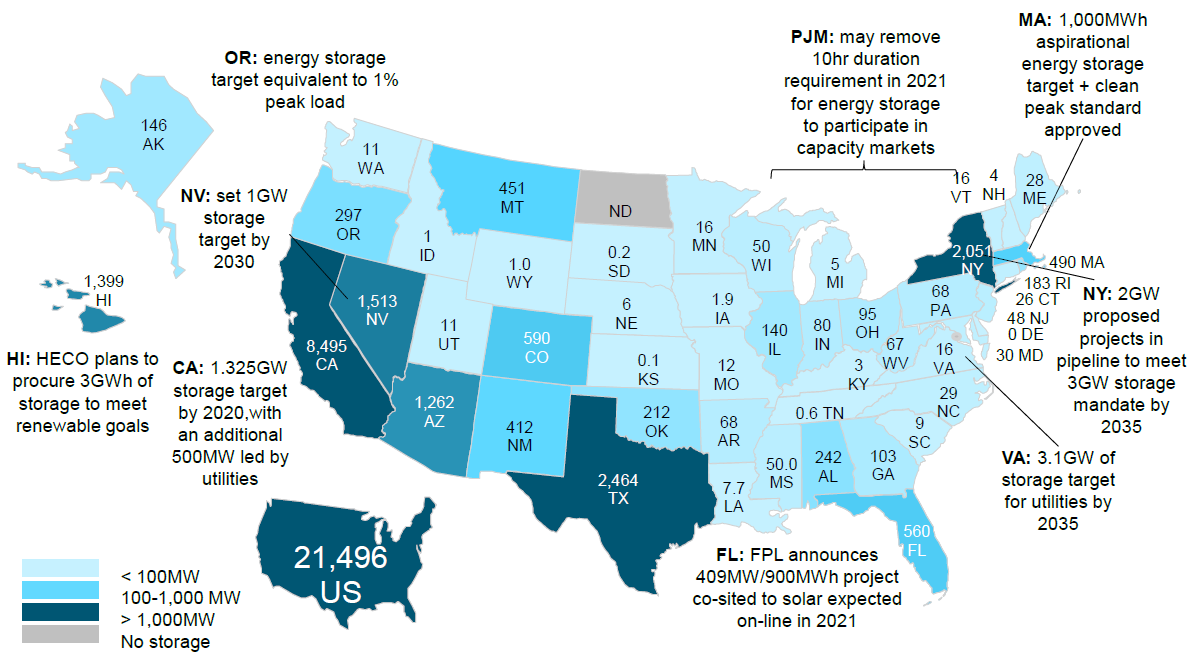
Furthermore, the non-programmable nature of renewables requires an adequate flexibility within the power system. This is evident especially when looking at the residual load, which is the load netted from the V-RES generation. When the residual load is greater than zero, renewables could not afford to provide the entire amount of requested energy, conversely when the residual load is negative there is a surplus of V-RES. This is especially true for areas characterized by a high PV penetration, like California, where at sunset a great amount of energy is needed to substitute the solar source. The use of energy storage is a flexibility measure that could enable to collect energy where it is abundant and utilize it when needed. It is remarkable to notice that the states with the largest capacity of energy storage projects are those in the areas with greater V-RES potential, as Figure 12 shows.
Currently, pumped hydro accounts for over 90% of US energy storage, with the remaining share mainly based on Lithium-ion batteries: An increase of non-hydro storage is recommended to locate the devices where they are needed most, together with a diversification of technologies (e.g., CAES, LAES) to decrease the dependency on lithium and cobalt.
Surely, another flexibility option is electric vehicles (EV), which can provide grid services through their batteries to ensure the stability of the power system. Several forecasts on EV presence have been elaborated by agencies and institutes and for 2030 a mid-range scenario puts 20 million EVs on US roads, containing up to 1,600 GWh of energy and providing up to 300 GW of power: a valuable resource for the power system considering that cars are on idle for 95% of their time, while at the same time they can help to decarbonize transportation sector, which is now the main contributor in US GHG emissions.

In conclusion, the pathway to a progressive decarbonization of the power sector must address investments in new RES power plants, and equally important is keeping the spending pace on transmission grid infrastructures compounded with flexibility measures. This is especially important in the US where the whole power system is split in three main synchronous pools that are poorly interconnected.
in cooperation with CESI – by Bruno Cova & Luca Migliorini