Which roadmap for energy transition?
The target established first in the 2015 Paris Agreement, and then confirmed in the recent Glasgow Climate Pact, aims to limit the increase of the mean global temperature to 1.5°C with respect to the pre-industrial levels. Scientists consider this increment as the value limit to avoid the catastrophic consequences of climate change, whose signals have alarmingly started to emerge in recent years with a substantial increase in extreme weather events, causing enormous damage to economies and people.
Translating the temperature target into a more practical perspective entails attaining the so-called “net zero” of CO2 emissions by 2050. But how will it be possible to realize this reduction? Is there a unique roadmap to achieve this objective or are there several alternatives? Which are the priorities to be addressed and the must-haves to be implemented?
This analysis will attempt to answer these questions by comparing the different scenarios provided by three major research organizations – the International Energy Agency (IEA), the International Renewable Energy Agency (IRENA) and BloombergNEF – to reach net zero CO2 emissions by 2050. Exploring assumptions, methods, common features and differences, the key challenges to be addressed are highlighted. Indeed, to take action right now is fundamental to change course as the measures, which will affect entire sectors and value chains, need to be planned in advance. This approach is also essential for a correct allocation of the significant investment packages approved in different countries worldwide to boost economic recovery after the Covid-19 crisis.
Read also: An outlook on the green transition after COP26
The first step is to examine the current situation in terms of CO2 emissions for each relevant sector and to assess the descent trajectory towards net zero. The figures below present the historic and expected global energy-related CO2 emissions up to 2050 to reach this target.
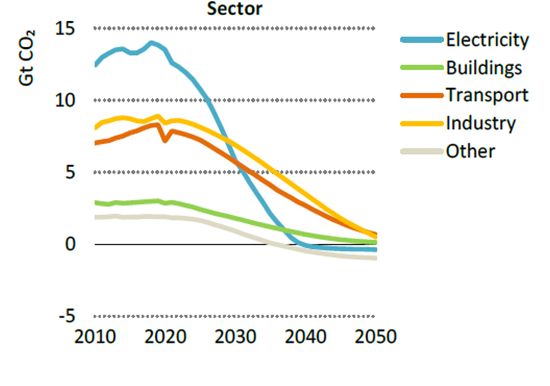
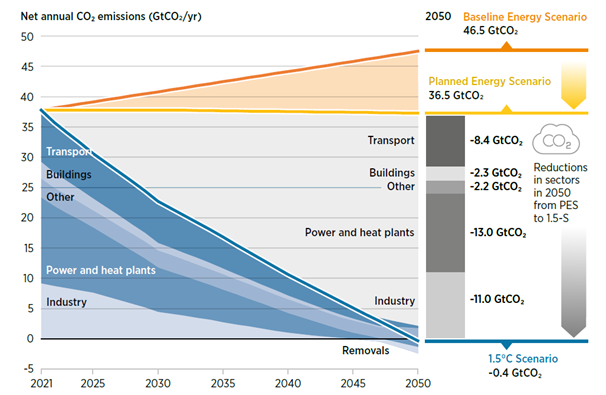
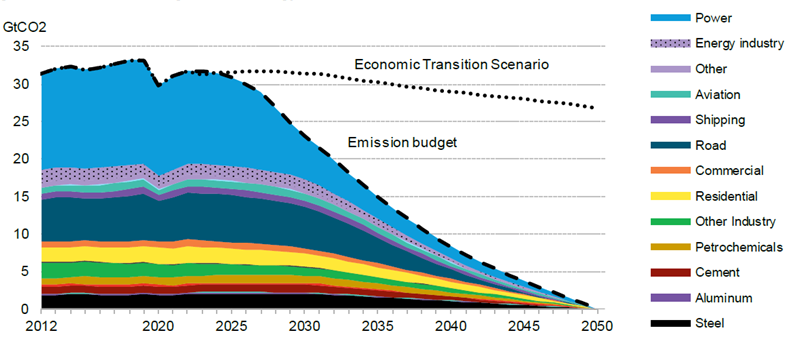
As can be seen from the IEA and BNEF data, CO2 emissions have slightly increased in the last decade, registering a contraction only in 2020 due to Covid-19 restrictions, which impacted mainly the transport – especially road transport – and the power sector. Among the three scenarios, BNEF is the more conservative with a flattened profile in the first years due to the economic rebound and then a constant reduction of emissions from 2025. The three roadmaps agree that most efforts are needed for the electricity sector, which must offset around 13 Gt CO2, followed by industry (especially energy, cement and steel) and transport.
The next step is to identify the actions to accomplish the emissions abatement: Figure 4 provides a summary of the mitigation measures of the three agencies. It is important to note that BNEF provides three different scenarios: a “green scenario”, focused on renewables and green hydrogen, a “gray scenario” with a significant role for carbon capture, utilization and storage (CCUS), and a “red scenario” in which nuclear power is the main source of electricity.
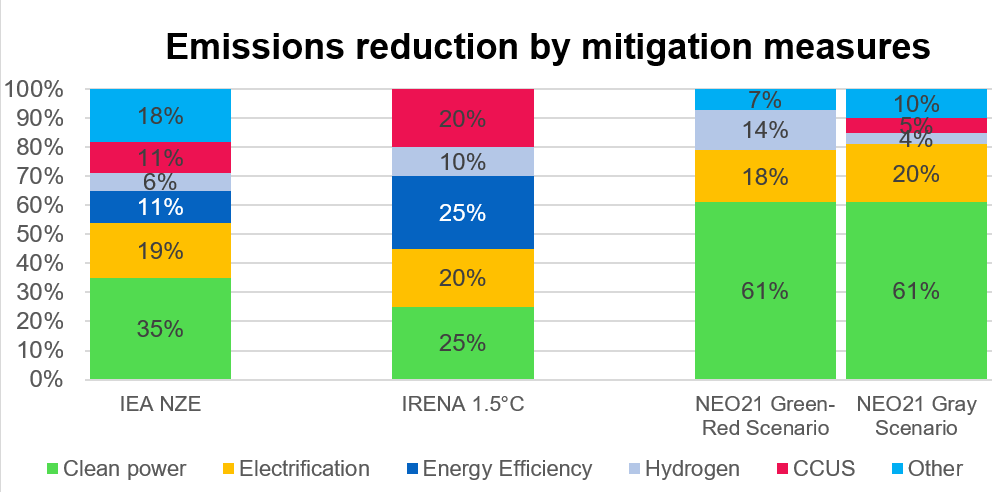
All the scenarios agree that clean power is the first mitigation measure: the share projected by IEA and IRENA (respectively, 35% and 25%) refers only to renewables, whereas the 61% figure projected by BNEF also comprises nuclear power and fossil fuel electricity coupled with carbon capture, utilization and storage (CCUS). Another element in common is the role of electrification in the end uses, with approximately 20% in the different scenarios, implying a more relevant role in the near future of electric vehicles, heat pumps and the use of electricity for heat applications in heavy industry. Energy efficiency is a relevant instrument according to IRENA, while in the other scenarios it covers a more marginal role. Emissions reduction linked to hydrogen range from 4% in the BNEF gray scenario, where its function is substituted mainly by CCUS, to 14% in the green-red scenario with the production of hydrogen through renewables and nuclear electrolysis. Finally, CCUS is a significant measure according toIRENA and the BNEFgray scenario (5% refers only to the end uses, another 13% is considered within the clean power segment).
Once the mitigation measures are identified, it is necessary to determine the proper breakdown of the final energy consumption to ensure the expected emissions abatement: Figure 5 provides the current situation in 2020 and the comparison between the different scenarios for 2050.
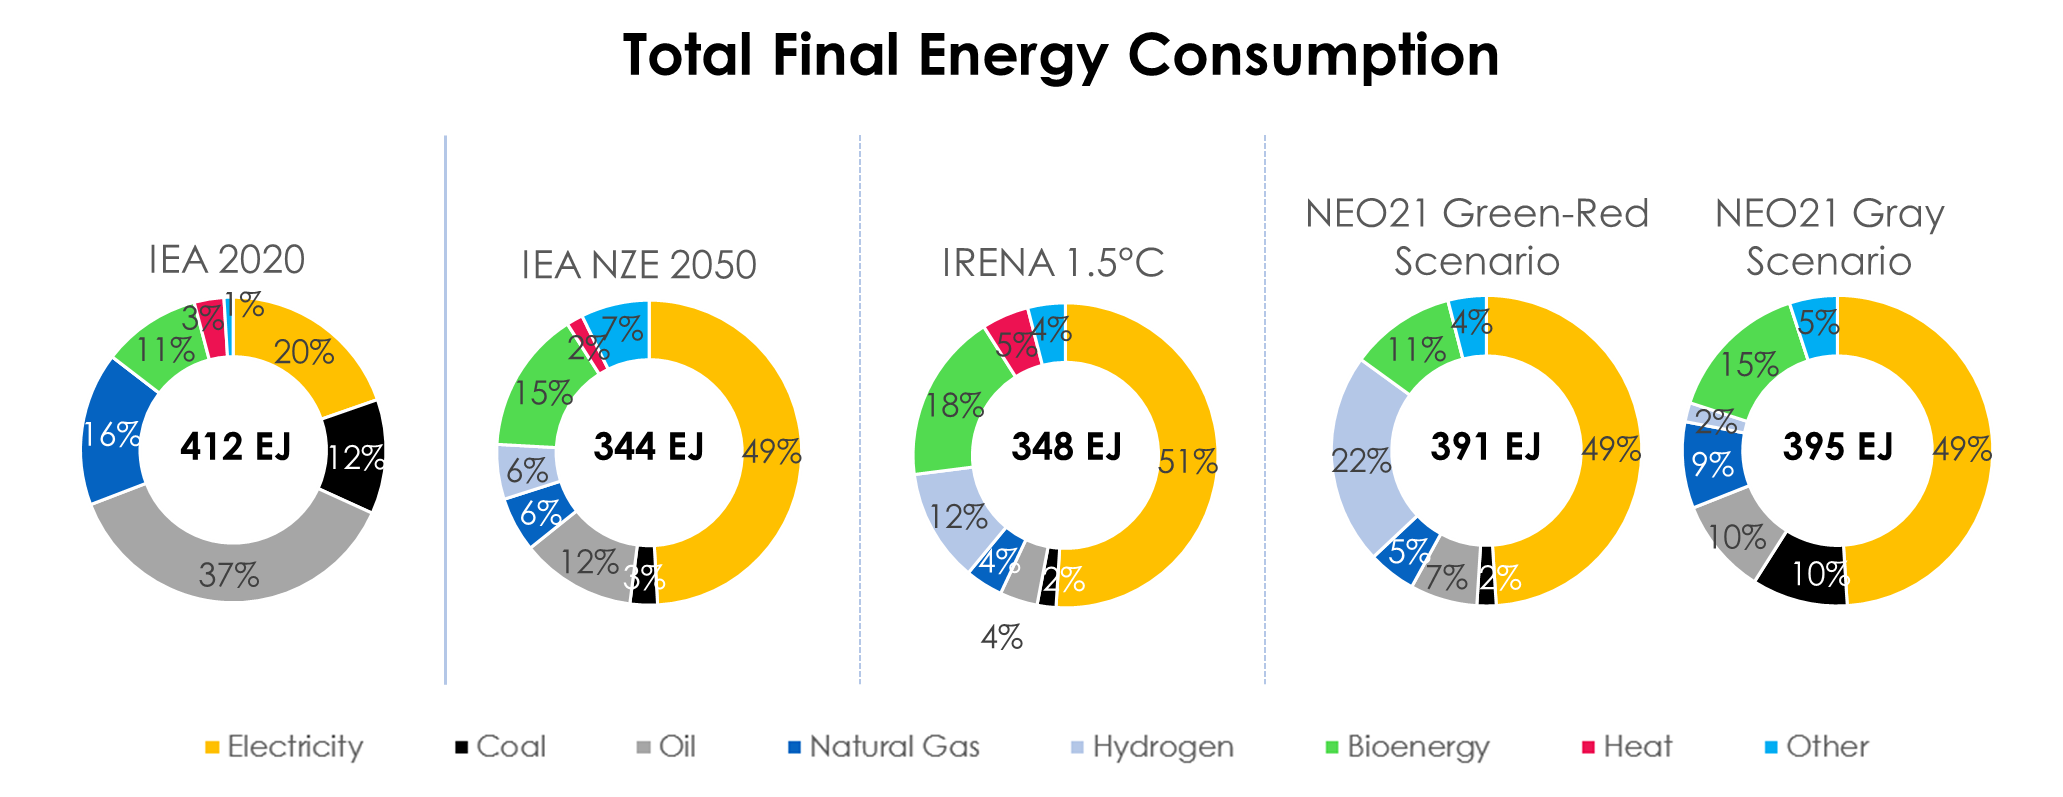
Firstly, it is remarkable to notice the decrease of the final energy consumption in all scenarios compared to the current level, as a result of energy efficiency, technology improvements and electrification. Indeed, electricity more than doubles reaching in all cases approximately 50% of the final consumption in 2050 due to the electrification of end uses, causing on the other side a substantial drop in oil demand mainly attributable to the transport sector. Hydrogen use has different perspectives according to the scenario: IEA and the BNEFgray scenario foresee a smaller contribution, whereas its consumption is more relevant in the IRENA and the green and red scenarios, reaching a 22% share. According to the IEA the industry sector accounts for almost 50% of the final energy consumption, whereas transport and building split the other half with ca. 25% each, in decrease with respect to current level thanks to electrification and energy efficiency measures.
Considering the relevance of the electric carrier, a specific focus on electricity generation is needed, as provided in Figure 6.
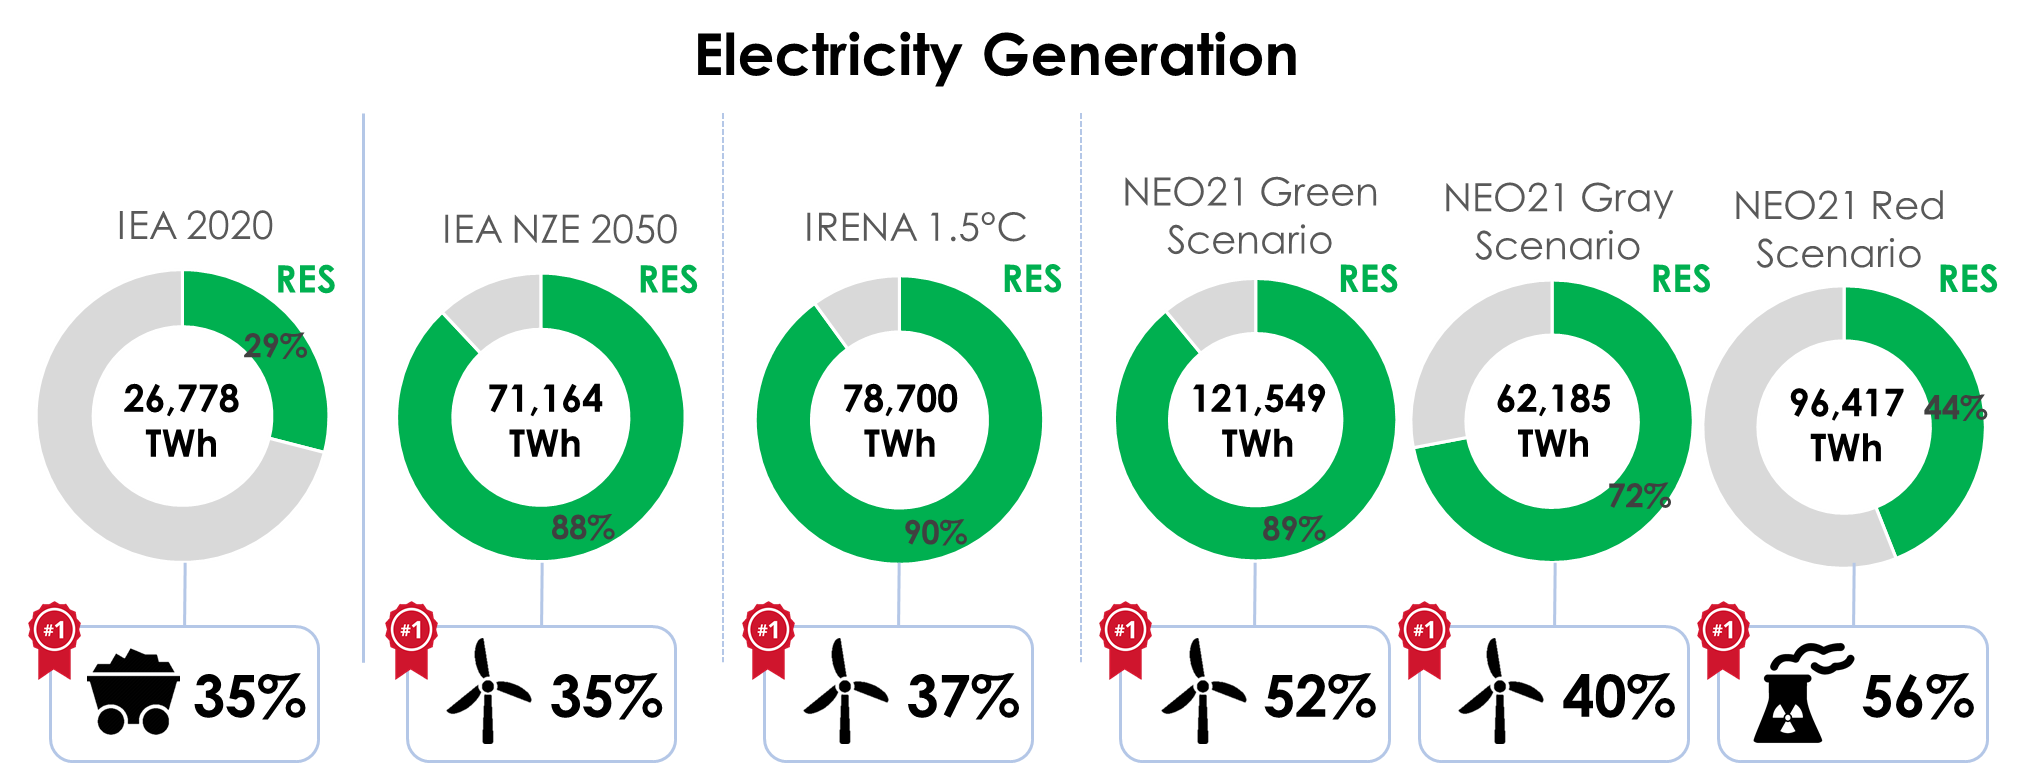
The figures highlight a leap in electricity between 2.3x and 4.5x compared to the current level: IEA and IRENA are almost aligned with a total between 71,164 and 78,700 TWh; BNEF provides upwards and downwards limits with 62,185 TWh for the gray scenario, characterized by larger use of CCUS instead of hydrogen and 121,549 TWh for the green scenario, which include a significant amount of electricity dedicated to the production of green hydrogen.
Read also: Ensuring energy security in a carbon-free economy
The share of renewables grows from the current 29% to approximately 90% in the IEA, IRENA and BNEFgreen scenarios, whereas the gray and red scenarios consider a lower renewal energy sources share due to the coupling of fossil fuel electricity with CCUS and nuclear energy, respectively. The primacy of carbon as most used fuel for electricity will be replaced in 2050 by wind generation, still with the same percentage for IEA and IRENA, while the BNEFray and green scenarios present a higher contribution, up to 52%; on the other side the Red Scenario is characterized by the prevalence of nuclear with 56% in the electric generation. This increase in renewable generation also implies a significant boost in installation of solar photovoltaics, whose capacity shall rise twenty times compared to 2020, and of wind plants, with a ten-fold increase, for a total of almost 23 TW in 2050 for those two sources, according to IEA.
This radical transformation of our energy systems entails an unprecedent implementation of investments, as illustrated in Figure 7.
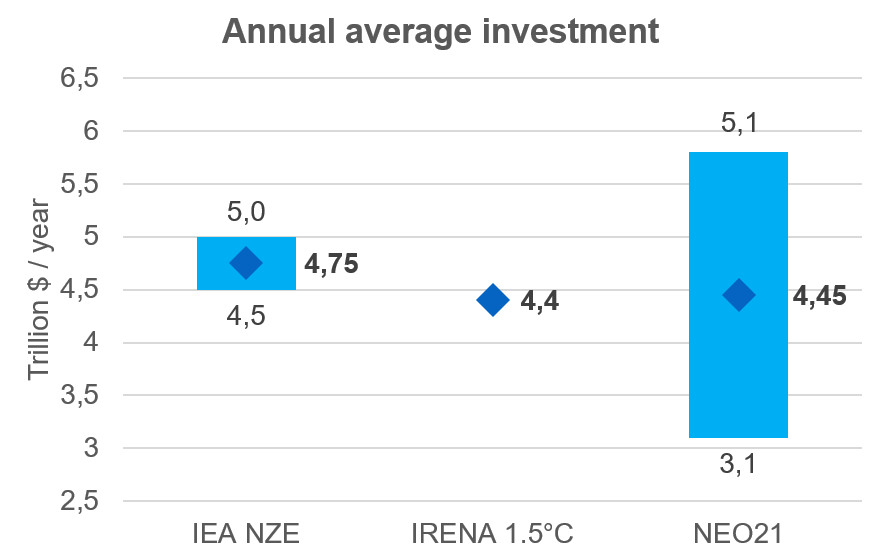
The average value of the investment is similar in the three scenarios, amounting to approximately $4.5 trillion per year. BNEF provides a wide range for this figure, likely including in this span the different scenarios presented in its outlook. The spending will be dedicated mostly to power generation, networks and electrification technologies.
Those investments have then an impact on employment, which could be already visible in 2030, as showed in Figure 8.
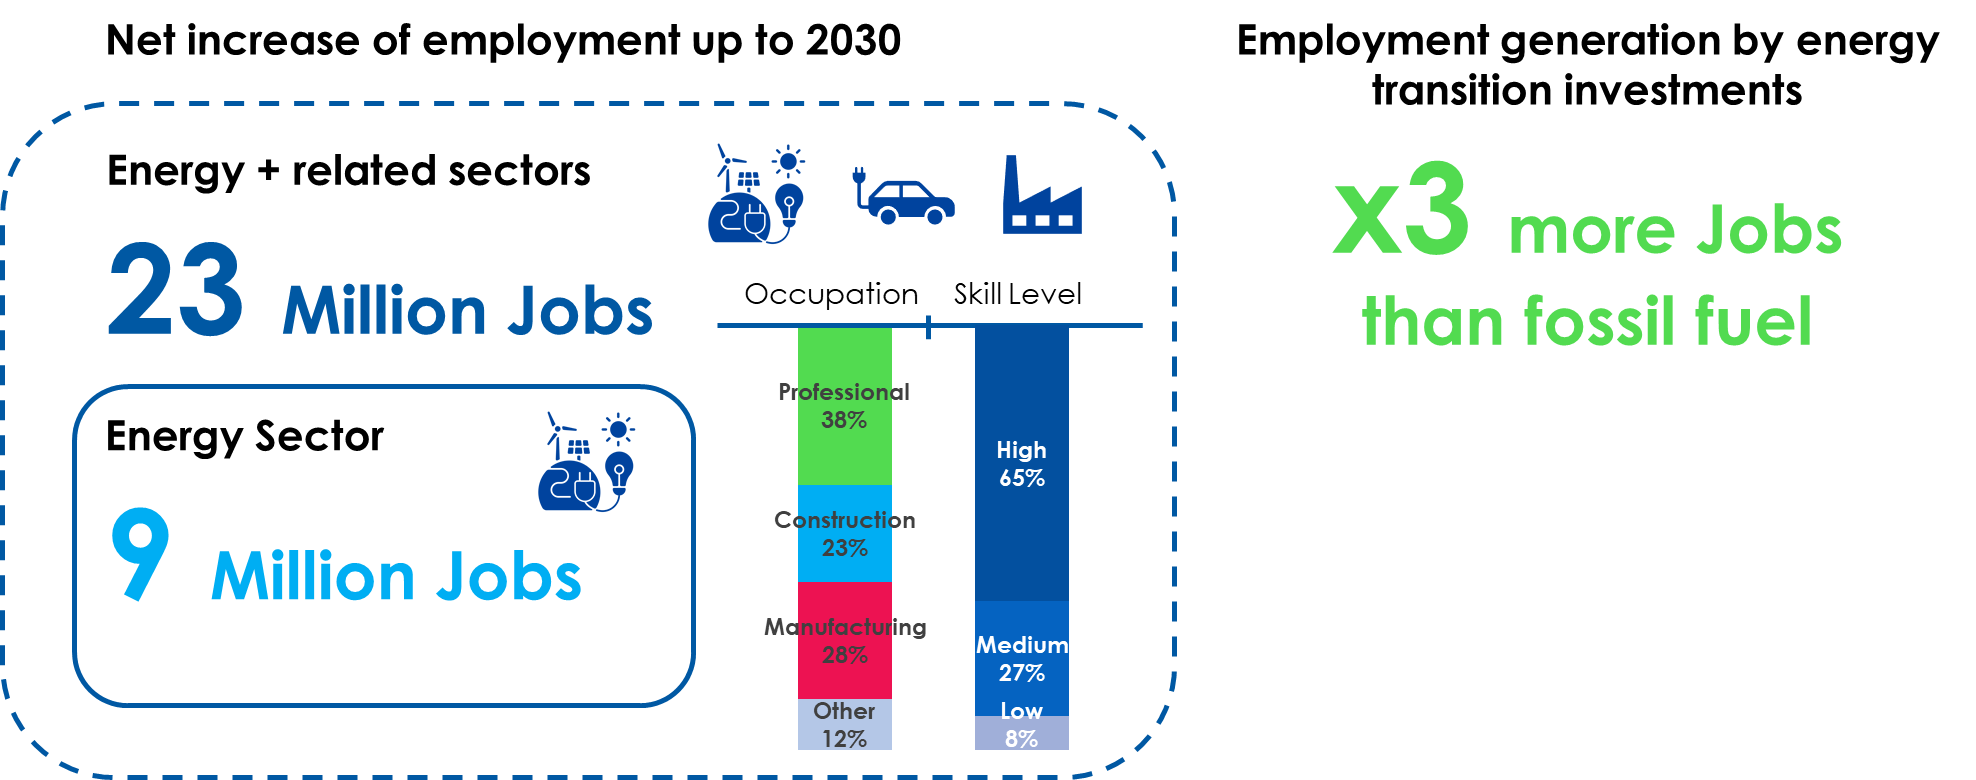
According to IEA, the energy sector alone could by 2030 produce a net increase of nine million jobs, reaching the 23 million mark by also considering the related sectors such as e-mobility, building and industry efficiency. Such jobs will be covered mainly by professional figures, followed by manufacturing and construction experts; over 50% of the jobs would require high skill levels. Investing in clean technologies is a win-win situation. IRENA estimates that for each million dollars spent in energy transition technologies up to three times more jobs are created than fossil fuels; however, it is necessary to quickly start implementing roadmaps and investments to reap all the benefits of decarbonization.
The green transition and energy security after COP26 – in cooperation with CESI