Taking stock of the demographic challenge in the Old Continent
Major demographic changes are taking place in Europe, affecting the age structure and population dynamics of the continent in what seems to be the most advanced phase of demographic transition that the world has experienced in history. Europe may now deserve the name “Old Continent” not only for historical reasons, but also for its demographic characteristics.
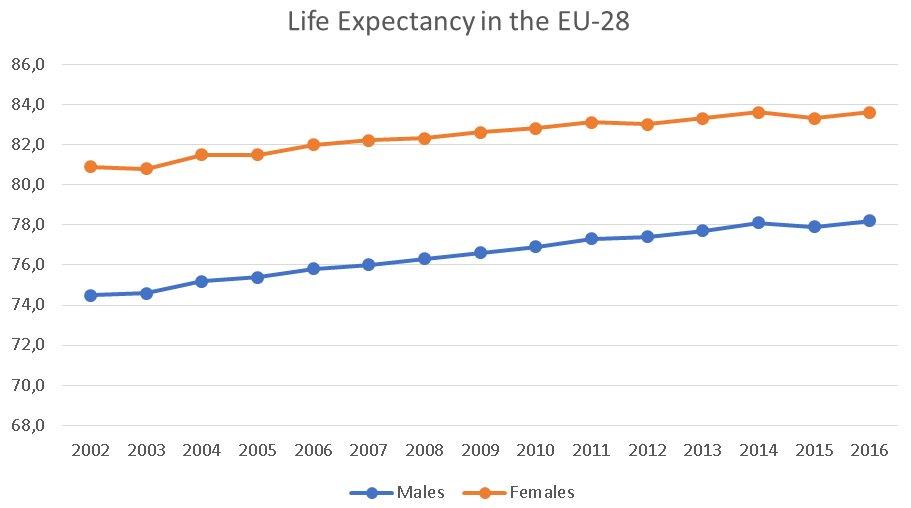
According to Eurostat, life expectancy at birth in the EU-28 has been steadily increasing in recent years: in 2016, it was around 81 years, an increase of 0.3 years with respect to the previous year. From 2002 until 2016, life expectancy increased in Europe by 3.3 years. The increase was higher for men – 3.7 years – than for women – 2.7 years. However, women – a very common phenomenon in both developing and developed countries – still have higher life expectancy with respect to men: in 2016 it was 83.6 years, with a gender gap of 5.4. Life expectancy at 65 is increasing as well, reaching 21.6 years for women and 18.2 years for men.
Another factor contributing to the aging of the European population is the low fertility level, a phenomenon that has been persisting for decades. Although the birth rate in Europe decreased at a slower pace in recent years than before, the total fertility rate in 2016 was only 1.6.This is much below the replacement level for developed countries, which corresponds to 2.1 live births per woman. Several countries reached or almost reached the so-called lowest-low fertility that corresponds to 1.3: Spain and Italy values in 2016 corresponded to 1.34 and Cyprus and Malta to 1.37. Almost half of children born in Europe in 2016 were first born children, and the mean age of women at childbirth in 2016 was 30,6.
The results of these two phenomena are: the total population growth has been slow or stagnant in many European countries; at the same time, the age structure is changing as the share of older people increases. In 2013, the European Union population increased only by 3.4 people per 1,000. These demographic dynamics, in turn, have very important bearings on the sustainability of the economy and the social welfare of the Old Continent.
First of all, these changes have relevant effects on the labor markets and, in turn, on the pension systems. The employment rate of older people (aged 55 to 64) has been increasing steadily in recent years both for women and men. The public cost of pension systems in the European Union can increase due to population ageing; for now, it remains at around 11% of the total GDP. The employment rate of older workers still has room for improvement: it corresponded only to 51.8% in 2014, whereas the rate of prime-aged workers (25 to 54) was 77.5%. Moreover, it is considerably lower than in other developed countries in the world like the United States or Japan, respectively corresponding to 60.9% and 66.8% in 2013. A longer working life is the only sustainable response to structural longevity and this fact has led several countries to reform their retirement systems accordingly. There are significant variations across member states: in 2014 the employment rate of older workers in Greece was only 34%, while in Sweden it amounted to 74%.
Another aspect worth considering is the impact of these dynamics on healthcare costs. Although life expectancy is increasing, healthy life years at age 65 did not increase in line with it in recent years. In 2012, both women and men aged 65 could expect to live in healthy conditions only other 8.5 years on average. Moreover, new policies should address what can be called a life expectancy inequality issue: people with lower education levels and/or socio-economic status in Europe show significantly lower averages of life expectancy.
When considering demographic changes in the Old Continent, migration flows play a fundamental role. As a matter of fact, population growth in many member states today is mainly driven not by the so-called positive natural change (which happens when births exceed deaths), but by positive net migration, which means that immigration exceeds emigration. If we take the average for the whole European Union, we can see that in 2013 the rate of the net migration was 3.3 per 1,000 people, while the rate of natural change only reached 0.2 per 1,000 people, and it is expected to become negative in the near future. Several countries in Europe already have a shrinking population. The highest levels of positive net migration relative to the size of population were recorded in 2013 in Italy, Luxembourg and Malta. Immigration seems to have positive impacts with respect to the demographic equilibrium: immigrants participate in the labour market, often addressing specific shortages and postpone population decline due to the fact that they are on average significantly younger than the destination countries’ populations in the EU and due to their normally higher fertility rates than the local population.
Family structures in Europe are becoming more flexible and less traditional. Fertility patterns are evolving, and extramarital births are more and more common. With respect to wealth and income of families, it seems like fertility is a U-shaped function: the families at the bottom of the income distribution and the ones at the top seem to show higher fertility rates. This fact calls for the implementation of policies that encourage women participation in the labour market.
Europe is now facing an important challenge: how to remain a global model by designing sustainable and adequate social policies that can create a fair and efficient system in this advanced phase of the demographic transition. The “Old Continent” needs to be innovative and pragmatic.
* * *
TABS
| Life expectancy at birth in 2016 in EU-28 countries (Eurostat) | |||
| Total | Males | Females | |
| EU-28 | 81,0 | 78,2 | 83,6 |
| Belgium | 81,5 | 79,0 | 84,0 |
| Bulgaria | 74,9 | 71,3 | 78,5 |
| Czech Republic | 79,1 | 76,1 | 82,1 |
| Denmark | 80,9 | 79,0 | 82,8 |
| Germany | 81,0 | 78,6 | 83,5 |
| Estonia | 78,0 | 73,3 | 82,2 |
| Ireland | 81,8 | 79,9 | 83,6 |
| Greece | 81,5 | 78,9 | 84,0 |
| Spain | 83,5 | 80,5 | 86,3 |
| France | 82,7 | 79,5 | 85,7 |
| Croatia | 78,2 | 75,0 | 81,3 |
| Italy | 83,4 | 81,0 | 85,6 |
| Cyprus | 82,7 | 80,5 | 84,9 |
| Latvia | 74,9 | 69,8 | 79,6 |
| Lithuania | 74,9 | 69,5 | 80,1 |
| Luxembourg | 82,7 | 80,1 | 85,4 |
| Hungary | 76,2 | 72,6 | 79,7 |
| Malta | 82,6 | 80,6 | 84,4 |
| Netherlands | 81,7 | 80,0 | 83,2 |
| Austria | 81,8 | 79,3 | 84,1 |
| Poland | 78,0 | 73,9 | 82,0 |
| Portugal | 81,3 | 78,1 | 84,3 |
| Romania | 75,3 | 71,7 | 79,1 |
| Slovenia | 81,2 | 78,2 | 84,3 |
| Slovakia | 77,3 | 73,8 | 80,7 |
| Finland | 81,5 | 78,6 | 84,4 |
| Sweden | 82,4 | 80,6 | 84,1 |
| United Kingdom | 81,2 | 79,4 | 83,0 |
| Total fertility rate in 2016 in EU-28 countries (Eurostat) | |
| EU-28 | 1,60 |
| Belgium | 1,68 |
| Bulgaria | 1,54 |
| Czech Republic | 1,63 |
| Denmark | 1,79 |
| Germany | 1,60 |
| Estonia | 1,60 |
| Ireland | 1,81 |
| Greece | 1,38 |
| Spain | 1,34 |
| France | 1,92 |
| Croatia | 1,42 |
| Italy | 1,34 |
| Cyprus | 1,37 |
| Latvia | 1,74 |
| Lithuania | 1,69 |
| Luxembourg | 1,41 |
| Hungary | 1,53 |
| Malta | 1,37 |
| Netherlands | 1,66 |
| Austria | 1,53 |
| Poland | 1,39 |
| Portugal | 1,36 |
| Romania | 1,64 |
| Slovenia | 1,58 |
| Slovakia | 1,48 |
| Finland | 1,57 |
| Sweden | 1,85 |
| United Kingdom | 1,79 |