National governments everywhere are anxious to understand where to invest so as to make the most of their countries’ potential strengths. By scoring locations and sectors on a scale that measures capabilities and competitiveness – by using “progress indicators” – governments and businesses can evaluate where best to focus on innovation.
Many countries feel constrained – not merely with regards to income, but in a trap, where value-addition is not increasing. Let us take, for example, the case of Morocco. According to the OECD database for trade in value added, Morocco’s foreign value content of gross exports has gone from almost 27% in 2014 to 25.3% in 2016. However, Morocco’s trend is unclear: its foreign value-added content as a percent of gross exports has averaged just 25% since 2000. Morocco has invested in capabilities targeting the aerospace industry since the 1950s (investments include encouraging foreign direct investment and setting up joint ventures with sophisticated foreign aerospace partners, building local training schools for both flight and maintenance and repair, and supporting university engineering programs, to mention just a few). And yet, despite tremendous progress in manufacturing complex aerospace assemblies and other components, foreign value added remains stable overall.
Traditional analysis leaves plenty of room for opinion. What’s missing is debatable: many options are proposed (policies to adjust the role of state-owned enterprises, governance of economic zones, fiscal costs of foreign investments, incentives to stop the brain drain,[1] and so on). But, in the end, how does Morocco increase participation in high value-added activities such as aircraft assembly? Innovation is a key ingredient: it yields new practices, higher productivity and increased quality – all ingredients of sustained entry into higher value-addition industries. However, innovation also requires a kind of “nested” approach, building capability upon capability. Each step needs to be connected to the rest of the productive ecosystem so that citizens can understand and ultimately support the progress.
It is generally believed that if the right ingredients come together, innovation will happen. But a comparative advantage in markets is often driven by the combination of specific scientific, technological and other capabilities. It is possible to understand whether the collection of technology and other capabilities (for example, science or capital flows) in a specific place correlates with future competitiveness in complex products. The innovation signal exists in the noise, and yields patterns of capabilities, which come together over time to create future competitiveness. We are now able to ascertain this signal, and to create forward-looking indicators of the interaction between technology combinations and related capabilities with future competitiveness. We call the result of this approach the “Progress Indicator”.
Given the lack of fiscal space, most countries are looking for an innovation edge. Knowing which capabilities to develop in the long term matters: too early, and it may provide some immediate upside but lack sustainability; too late, and – while it may make falling behind unlikely – it will not contribute to catching up to or surpassing leaders in the relevant key sector.
NESTED CAPABILITIES. What are nested capabilities and how do they interact?[2] An analogy from the culinary arts helps illustrate the notions of capabilities and their “nestedness”. Before making a lasagna, a chef must first be able to prepare a good ragù and, before making a good ragù, a chef must be capable of preparing a simple tomato sauce. The capabilities required to cook these dishes are completely nested; that is, all the capabilities required for simpler dishes are necessary but not sufficient to prepare the more complex ones.
In the real world, of course, capabilities are not perfectly nested: is chicken tikka masala more or less complex than lasagna? Does it require more unique capabilities and their combination? Recent academic works have shown that non-randomly nested systems, in which more complex outcomes imply many of the capabilities needed to achieve simpler ones, are widespread in society as well as in nature. This characteristic can be used to uncover the fittest agents.
What we call “nestedness” enables a new approach: a dynamic process describing acquisition, the spread and use of capabilities, and the interactions between agents and their activities. While a system with few dependencies between different dishes would push chefs to specialize in a small set of arbitrary delicacies, the nested set of capabilities required for cooking compels the best chefs to learn the simpler dishes as well. Moreover, chefs operate and interact in well-defined locations. To define their menu, their own capabilities interact with environmental constraints and aggregated capabilities (such as local tastes, ingredients and traditions). The distribution of restaurants in a given area – say, California – reveals that Asian restaurants are concentrated mostly in and around San Francisco while Latin American restaurants are easier to find in Los Angeles. This level of geographical resolution of the representation – that is, the way in which data are aggregated to define the nodes of the associated network – highlights capabilities that emerge at a city level, regarding elements such as tradition and ingredient availability.
SENSING WHERE INNOVATION AND ADVANCED PRODUCTION CAN HAPPEN. Given the diminished fiscal space, globally, governments and attendant leaders and policy-makers generally seek to make the best use of revenue or borrowings. Bridges to nowhere and costly incentives given to building advanced but stranded capabilities are increasingly less comfortable choices. Such constraints call for a different approach – one built on path dependence and nestedness. This allows for capabilities to be harnessed in ways that are more likely to achieve future competitiveness in broad-ranging yet highly complex goods and services.
The global experience of trade, technology and science across all countries allows for a network representation with time-delay characteristics. A decomposition of the network using the “fitness methodology”[3] results in a characterization of locations (for example, countries) by their technological capability as well as by future production capabilities. As a result, it becomes possible to measure a country’s likely progress in capability development through increasing competitiveness in complex yet diverse production. The progress indicator allows for very granular comparisons across countries in different aggregations. The Chinese government, for example, analyzed such data in its “Made in China 2025 priority sectors”.
BEYOND CONVENTIONAL INDICATORS. One ubiquitous indicator of innovation is the Global Innovation Index (GII). The index consists of 81 indicators divided into pillars and sub-pillars. They are weighted on the basis of a panel of experts, and then averaged to produce an indicator for each country.[4] The new literature of “complexity and economic fitness” uses techniques which, differently from traditional index construction approaches (such as GII), do not try to average out the complexity of the system. Such techniques embrace that complexity by explicitly building on the heterogeneity of individual actors, activities and interactions, thereby extracting the relevant parameters that characterize the economic and innovation system. In this way, information about innovation and other capabilities may be extracted from the technologies in patents.
Interaction among technologies and their relatively unique combinations yield unique products – a precursor to future competitiveness. A measure of technological coverage (in which portfolios of technologies are held and observed through patents) together with the relative uniqueness of combined technologies is used to estimate the innovation capabilities within a country, a region, or even a single city.[5]
The process of developing advanced industries is a long and complex one for a country. Moreover, it holds a great deal of uncertainty with respect to the outcomes of the efforts and the less risky yet effective paths to follow for successful development impacts. It is hard to know where, when and how much to invest, and the Progress Indicator can inform such decisions.
Embedded in its current productive structure, there is abundant information about a country’s capabilities and about how its competitiveness levels compare to those of other countries. Such information can be revealed and used to assess the growth potential of a country,[6] not only in terms of gdp. A detailed analysis can be provided for those sectors in which a country is more likely to achieve uniqueness and sophistication. It turns out that the sets of products for which countries are competitive follow patterns that are recurrent and predictable.
The Progress Indicator relies on a probabilistic relationship between the present status of a country and its likelihood to progress in specific sectors within a given span of time (typically 5-10 years). The score allows credible responses to questions like: “What is the probability that China will become a competitive exporter of biotechnology in 2025, given the set of products and capabilities – including technological and scientific – in which it is competitive in 2015?”. The answer depends on the experience of countries that have previously trod the same path, and on the relevant features of the technology basket of countries that have developed the same product before. By minimizing the effect of the curse of dimensionality and bias-variance dilemmas, relatively reliable predictions can be made.[7]
MADE IN CHINA 2025 PRIORITY SECTORS. “Made in China 2025” comprises a set of priority goods and services identified by China’s National Development and Reform Commission with the Ministry of Science and Technology, Ministry of Industry and Information Technology, and several departments. All together, they followed a consultative selection process to create a “Guidance Catalog”.[8] Five pillar areas, organized into eight priority industries, 30 sub-industries and nearly 4,000 goods and services, were identified.
Figure 1 – China’s progress score
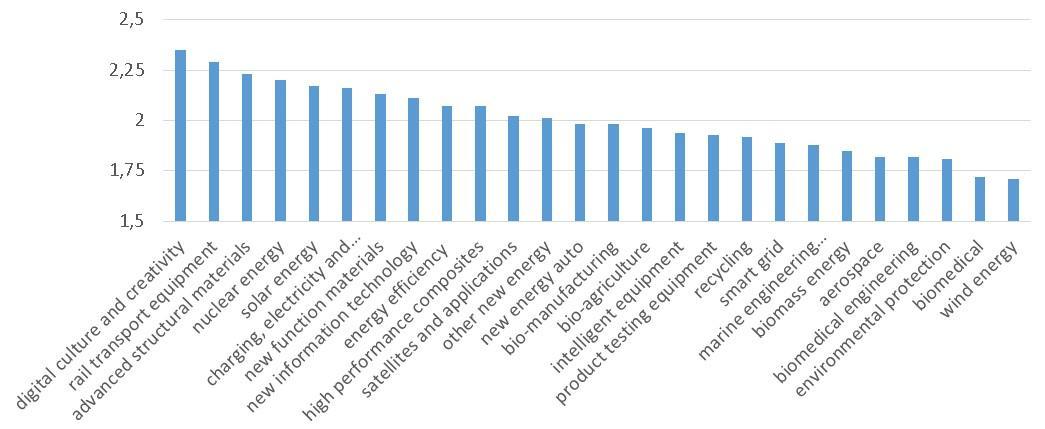
China’s scores range from 2.35 (digital culture and creativity, or DCC) down to 1.71 (wind energy). This means that China has a high chance of using technology and other capabilities to make outsized progress in dcc and a much lower chance to do so in wind energy. The wind energy sector is saturating and China is likely to make the least progress there, relative to all other sectors considered and also relative to the USA, Germany and Japan.
Another potential tool is provided by calculating when and where countries partner. Where do the opportunities lie for bilateral exchanges that will benefit both countries, while leveraging complementary capabilities? The Progress Score indicates, for example, that in sectors such as biomedical engineering and environmental protection, China can learn substantially from Germany. Indeed, the latter country stands to make the most progress in both these areas. This finding would typically have gone unnoticed in the past: a weak signal washed away by analysis in the aggregate. But this type of complementarity dovetails with the increasingly observed partnerships between China and Germany. The proposed GEIDCO initiative, for instance, calls for transmitting wind energy from China to Germany, by 2030, at a cost of about 12 cents per kilowatt hour (or about half the current German consumer cost for clean energy). Germany’s performance in these areas also means that China can become a client of newer and more effective technologies to control carbon and industrial pollutants.
Figure 2 – Progress scores of China and Germany
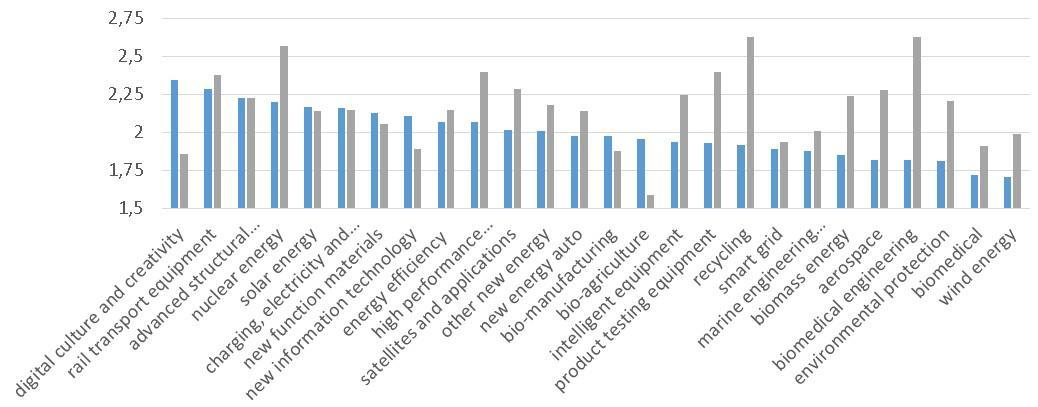
In other areas – such as digital culture and creativity – China is poised to provide expertise and novel products around artificial intelligence and digital software platforms. This result reflects the tremendous investment China has made in ai planning. As McKinsey&Company stated in its July 13, 2018 Shortlist: “This flourishing digital culture is paying innovation dividends, as China is home to one in three of the world’s ‘unicorns’, or start-ups with more than $1 billion in market cap. And China now places in the top ranks of global venture-capital investment in virtual reality, autonomous vehicles, 3d printing, robotics, drones, and artificial intelligence.”
TOWARDS THE FUTURE. The analytical philosophy of “complexity and economic fitness” gives rise to a number of indicators. These indicators extract weak signals from noise, maintain or improve statistical power over traditional aggregate statistics, and provide credible assessments and guideposts to the future. Countries are anxious to understand how best to take advantage of unique capabilities, and how best to develop ways to build nested structures, which will yield advanced and globally competitive products. “Progress Indicators” help identify those areas of cooperation and strategy formulation that are more readily assessed across broad swaths of economic development and innovation.
Footnotes:
[1] Morocco has science and engineering talent but, as King Mohamed vi put it recently, “many young people in Morocco – especially university graduates in science and technology – are thinking of emigrating, not only because of the tempting material incentives abroad but also because they do not find in their country the appropriate conditions for employment, career advancement, innovation and scientific research.” The Arab Weekly, September 10, 2019.
[2] This section on nestedness was prepared by Lorenzo Napolitano, who used much of this content in his PhD dissertation at La Sapienza, University of Rome.
[3] “Economic fitness” was first proposed by Andrea Tacchella, Matthieu Cristelli, Guido Caldarelli, Andrea Gabrielli and Luciano Pietronero in “A new metrics for countries fitness and products complexity,” Scientific Reports 2, art. 723, 2012. It has been developed, refined and adopted in various studies since then.
[4] Soumitra Dutta, Bruno Lanvin, Sacha Wunsch-Vincent, Global Innovation Index 2017: Innovation feeding the world, tenth edition, World Intellectual Property Organization, Geneva 2017.
[5] Emanuele Pugliese, Giulio Cimini, Aurelio Patelli, Andrea Zaccaria, Luciano Pietronero, Andrea Gabrielli, Unfolding the innovation system for the development of countries: co-evolution of science, technology and production. Not yet released.
[6] Matthieu Cristelli, Andrea Tacchella, Masud Z. Cader, Kirstin Roster, Luciano Pietronero, On the predictability of growth, Policy Research working paper no. 8117, World Bank Group, 2017.
[7] See for example Brian D. Ripley, Pattern recognition and neural networks, Cambridge University Press, 1996.
[8] “Strategic emerging industries, key products and services Guidance Catalog”, National Development and Reform Commission, People’s Republic of China, 2016.
This article reflects the personal views of the author and does not represent the position of the IFC or World Bank Group.