What does the drop in oil prices mean for the Chinese economy?
Crude oil prices have dropped precipitously since the summer of 2014 thanks to sustained growth in US tight oil supply, OPEC’s decision not to cut production, and weak global demand. Slower Chinese economic growth generally and a drop in energy-intensive economic activity in particular are widely understood to have been significant contributors to that weak global demand, and thus an important driver of the oil price collapse. Less understood is the impact of low oil prices on the Chinese economy.
China in a global oil market context
Between 2002 and 2014, Chinese oil demand averaged 6.5% per year growth, and accounted for 35% of total global demand growth during that period. While China has a relatively robust domestic oil processing industry, production growth has been slow, averaging 1.8% per year over the same period. As a result, demand growth has been met primarily through imports, with China surpassing Japan to become the world’s second largest oil importer[1] in 2010. It will likely pass the US to become the single largest oil importer by the end of 2015. China’s oil import bill rose from $13 billion in 2002 to $226 billion in 2014. As a result, one of the largest declines in import bills from the oil price collapse, in absolute terms, has likely occurred in China. Using 2014 net import data, the fall in global oil prices from an average of $111 per barrel[2] in June 2014 to an average of $48 per barrel in January 2015 saves China $142 billion on its annualized import bill. The US, by comparison, saves $168 billion.
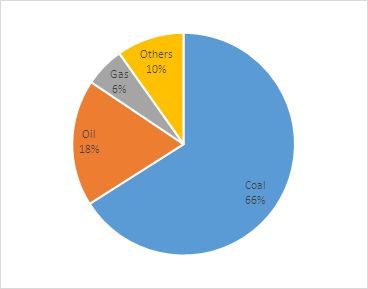
While large in absolute terms, China’s oil import savings are relatively modest in relation to other countries when measured as a share of GDP. This is due in part to the dominant role coal plays in China’s energy system, supplying 66% of the country’s energy needs in 2013 (Figure 1). Oil accounts for only 18% of energy supply compared to a global average of 31%. China’s economy has also become less energy intensive over the past decade, reducing the amount of coal, oil, natural gas or other energy input required to produce a typical unit of economic output.
The import savings from a $111 to $48 per barrel drop in global oil prices amounts to 1.4% of Chinese GDP – if measured against 2014 oil imports and economic output. Using 2013 economic output and oil imports numbers (the most recent year for which global data is available), that same drop in oil prices would have reduced China’s import bill by 1.3% of GDP. As shown in Figure 2, this puts China squarely in the middle of the pack. There are 120 countries for which the oil price collapse matters more when measured purely as a reduction in net oil import costs. Small, poorer countries that rely on oil for power generation are the biggest winners. For Djibouti, Jamaica and Jordan, for example, the oil price collapse reduces net import costs by 18, 11, and 7% of GDP, respectively. India saves 3% of GDP on its import bill (and a considerable amount on government expenditures, given the prevalence of oil price subsidies in the country). China does better than the United States, but only slightly; the oil price decline shaves 0.9% of GDP off US net import costs at 2013 import and economic levels, and 1% of GDP at 2014 values.
Figure 1: Chinese energy supply by source (%), 2013

Source: National Bureau of Statistics, China via CEIC
Figure 2: Change in oil import costs as a share of GDP
Impact of a change in oil price from $111 to $48 per barrel on 2013 net oil imports

Source: Energy Information Administration and International Monetary Fund
The structure of China’s economy further mitigates the benefits of the oil price collapse
While useful for broad comparative purposes, a decline in net import costs is not a comprehensive measure of the impact on a nation’s economic activity. The typical economic benefit of a decline in oil prices is a reduction in household energy costs that reduces overall inflation and increases spending on other goods and services. In the United States, private vehicles account for a significant share of overall oil demand; thus, households accrue a large share of the benefits of a drop in oil prices directly. Not so in China. Industry has been the main driver of energy demand in China (Rosen and Houser, 2007) and this includes oil. Industrial consumption accounts for nearly half of oil consumption in China and within the transport sector less than one-third of demand comes from private vehicles (Figure 3). The majority is consumed transporting freight on trucks, trains, and barges. Thus, in China, lower oil prices primarily benefits the industrial sector by directly lowering production costs.
Figure 3: Oil demand by various sectors (%)

Source: IEA and RHG estimates
Industry usually passes much of such cost reduction on to consumers by lowering the price of goods. In China, however, households consume less than 30% of final goods and services (Figure 4). The remainder is used for capital investment, exports, and government consumption. Hence, relatively little of the savings from the oil price collapse in China will translate into higher consumer spending in other areas.
Figure 4: Share of final demand (%), 2013

Source: World Bank
Conclusion
Much lower oil prices are good news for the Chinese economy – once one gets past the fact that China’s own slowdown is a significant cause of that collapse. But while the savings are large in dollar terms, the impact on overall growth will be much less for China than in other countries. Chinese consumers benefit, as lower oil prices reduce inflation and consumers have extra money in their pockets to increase consumption, but those gains are modest. And much of the benefit of a reduction in Chinese oil purchase costs will accrue to other countries, which will enjoy slightly lower prices for the goods China exports.
[1] Throughout this piece, the term “oil imports” refers to net oil imports (consumption minus production) of crude oil and refined petroleum products.
[2] Based on Brent crude spot prices as reported by the Energy Information Administration
Bibliography
EIA. 2014. “International Energy Statistics.” Accessed February 2,2015. http://www.eia.gov/cfapps/ipdbproject/IEDIndex3.cfm.
IEA. December 2003. Oil Market Report. Paris: International Energy Agency.
IEA. January 2015. Oil Market Report. Paris: International Energy Agency.
Rosen, Daniel H, and Trevor Houser. 2007. China Energy: A Guide for the Perplexed. Washington D.C.: Peterson Institute for International Economics.
The author thanks Trevor Houser, Daniel Rosen, Jasper Hitchen and Beibei Bao for their valuable suggestions.